
We bring expertise in carbon markets, decarbonisation strategy, and value creation

Access our case studies
Enter your details to access our case studies and learn how MacGregor Advisory Group helps clients with:
- Demand-side challenges
- Marketplace Matchmaking
- Supply-side solutions
Thank you! We’ll be in touch soon.
Something went wrong while submitting.
Demand-side challenges
Our team has deep expertise assisting
Oil and Gas industry
Defining the strategic case for carbon market participation

Power sector
Strategic alignment to de-carbonise power section within an EU country
Climate
Global multi asset class asset manager
Green investment products
Determine exposure to future growth sectors and long-term value
DEEP DIVE
Oil & Gas industry
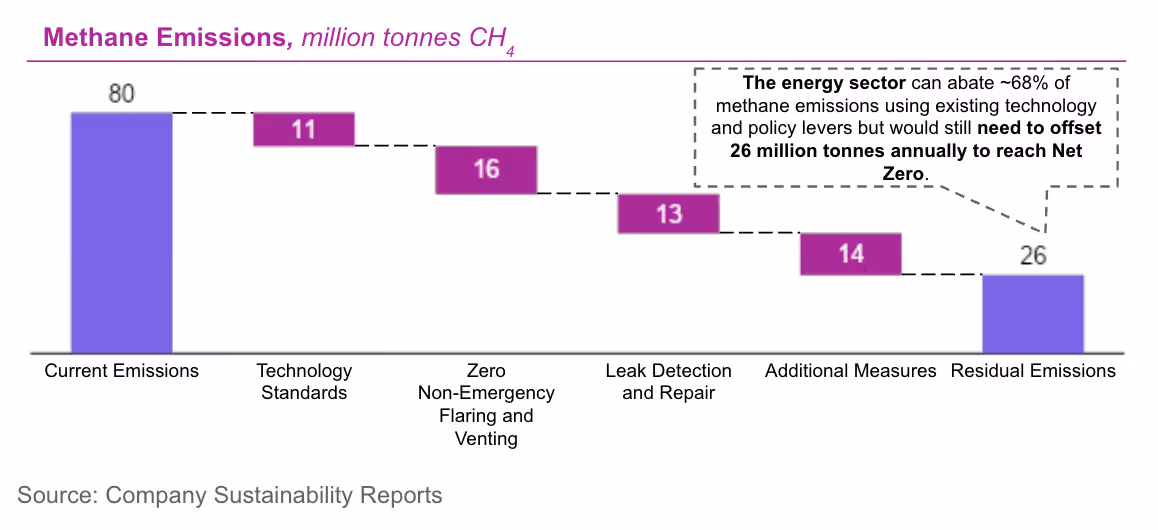
We advised the client on how to address methane emissions challenges in Oil & Gas and identified commercial options to monetise abatement and offsets
As part of our broader analysis, we identified Oil & Gas as the second-largest source of anthropogenic methane, primarily emitted during extraction.
Industry overview:
- Methane is emitted from Oil & Gas operations during production, representing one of the best near-term opportunities for climate action because the pathways for reducing them are well-known and cost-effective.
- Around 40% of oil and gas methane emissions could be reduced at no net cost using existing technologies (e.g. leak detection and repair campaigns, installing emissions control devices, etc.).
- After abatement projects are carried out, the key challenge in reaching Net Zero methane emissions is the residual hard-to-abate emissions.
- These emissions create a strong need for credits specifically reducing methane.
Three key factors drive the demand for methane reduction credits from Oil & Gas majors:
- Regulatory scrutiny on methane emissions
- Hard-to-abate residual emissions
- Continued demand for Oil & Gas in a Net Zero world

Supply-side solutions
Our team has deep expertise assisting
Nature Based Solutions
Carbon Credit (CORSIA / Singapore) Go-to-market strategy
.svg)
Chemical industry
Re-imagined operating model using bio-feedstock
Petrochemical industry
Operating Model transition and Value of Carbon for Corporate Capital
Carbon Inset asset transaction
Asset transaction including operational control to allow balance sheet insetting
Marketplace matchmaking
Our team has deep expertise assisting
Commercial strategy and carbon credits go-to-market
White paper
Analysis of Australian compliance hybrid and voluntary markets
Construction industry
Carbon market design and future trends
Carbon market buyer preferences
Different Carbon Credit products may preferentially fit some buyers/sectors
DEEP DIVE
White paper: Carbon market trajectory
We were engaged to develop a white paper on the evolving Australian carbon market and advise on its likely future trajectory
Among the depth of analysis we delivered, one of the most compelling insights was…


DEEP DIVE
Construction industry
We identified unmet demand for sustainable development in the construction sector in Australia and advised our client on how to unlock value through strategic sustainability
We discovered a strong demand for sustainable buildings in the APAC commercial sector in particular.

And then advised on emerging opportunities for developers to make meeting that demand more commercially viable.

DEEP DIVE
Carbon market buyer preferences
We performed buyer analysis for a decarbonisation solution provider to understand buyer preferences for carbon credits
Illustrative example of Carbon Market Buyer Preference analysis.